Date: 28/07/2020
Assisting in the Global COVID-19 Response through Innovative Research
Jeremiah J. Nieves 1, 2, Alessandro Sorichetta 1, Donna J. Clarke 1, Maksym Bondarenko 1, & A. J. Tatem 1
-
WorldPop, Department of Geography and Environmental Sciences, University of Southampton
-
Economic and Social Research Council, South Coast Doctoral Training Programme
Four months since the World Health Organization declared a pandemic caused by COVID-19 and over 7 months since the first cluster of COVID-19 cases were reported in China, we have all become more familiar with public health and public health measurements. The pandemic has affected our travel, our research, close friends and family, and most other aspects of our daily lives. Riding on a bus or waiting in a queue to do our shopping we often hear folks discussing the number of new cases as a bellwether of what next week will bring. But how do they determine the numbers that shape these health and policy decisions? And for a country with less resources than, say, the United Kingdom or Germany?
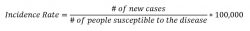
A common and important measurement used for monitoring diseases is the “incidence rate” – the number of new cases in a given time period per some standard size of population, e.g. per 100,000. In general, the incidence rate per 100,000 people for a given time period, say a day, can be calculated as
These rates are calculated for the past, the present, and there are even models that estimate new cases in the future.
In well-resourced countries, the number of susceptible people (with the case of COVID-19 simply the population) in an area can be estimated from a census, surveys, and a range of administrative sources. The areas used for counting cases can even be pre-made to match these population related boundaries. However, in low -and middle-income countries simply getting a contemporary estimate of the population in an area can be a challenge (1).
In many countries, data on population often are outdated, inaccessible across various governmental and health agencies, or simply do not exist (1). For instance, the Democratic Republic of the Congo’s last census was in 1984 (2,3). Or relatively current population count data are available, but the scale of the areas that they are made available at are relatively coarse, obscuring the true location of populations within. Depending on the health care system and reporting set up of a country, the areas used for collecting the number of new cases may not match up with the boundaries of available population counts and there may not be resources available to carry out surveys or other work to align the population and the case data.

Figure 1. Example where the boundaries by which population count data are available (in orange) may not overlap with the boundaries used for counting disease cases (in blue).
This is an issue because if we cannot determine the number of people in an area susceptible to the disease, our incidence rate will either be inaccurate or incalculable. So, if the population data is dated, and no resources exist to update them, conduct surveys, and align them with the areas used in disease case counting, the question becomes how do you determine the number of susceptible people?
This is where gridded and modelled population data such those produced by WorldPop (worldpop.org) can be critical. WorldPop takes census-based population estimates and enhances them into high-resolution population maps that are globally consistent and comparable. Between 2016 and 2018, WorldPop produced and released annual gridded population estimates from 2000-2020. The added benefit of this modelled and globally consistent approach is that we can increase the resolution of the population data, say from a single count for an administrative unit like a county, to producing a more realistic distribution of where those people are located within the original unit.
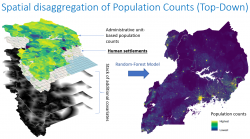
Figure 2. Graphic example of the WorldPop method of modelling (spatial disaggregation) population count data from a census by incorporating other data in the form of model covariates like night-time lights and distance to roads to better predict population locations. Figure provided by Alessandro Sorichetta (WorldPop, University of Southampton) and Maksym Bondarenko (WorldPop, University of Southampton).
Further, this high-resolution data is able to be aggregated to whatever larger area is needed. This means that population estimates for non-census areas, such as a neighbourhood or hospital service area, can be produced.
But if the WorldPop population layers are based upon the census counts and estimates largely from the last global round of censuses circa 2010, and cities and settlements have grown, how can estimates for the globe in 2020 be reliable? During the production of that data, while under ESRC SC DTP funding, I developed a model that could accurately predict built-settlement growth across the globe at high-resolution (4,5) from 2000 through 2020. I then worked with the team at WorldPop to integrate this data into the population modelling process and produce the population models. Given that we only had data on settlements up to 2014, the future predictions of my built-settlement growth model were the key driver of the 2015 to 2020 population models.
So, what does this have to do with COVID-19? Remember the models that produce estimates of future, new COVID-19 cases globally? Two of those COVID-19 models, produced by the Institute for Health Metrics and Evaluation (6) and Imperial College, London (7), have chosen the 2020 WorldPop global population dataset in order to be able to calculate and model the COVID-19 incidence rates across a variety of countries in a globally comparable way.
These two models are being used to guide national and international policy, guidance, and planning in our response to the COVID-19 epidemic. They have been featured in briefings by the US president and the UK prime minister (8,9) and continue to guide our pandemic response across the globe today (10,11). The population and settlement data has also been adopted and used for providing COVID-19 related information by the United Nations Population Fund (UN FPA) (12) and other non-governmental organizations (13,14). Additionally, researchers at WorldPop, such as Dr. Lai Shengjie, Dr. Nick Ruktanonchai, Dr. Corrine Ruktanonchai, and Jess Floyd, to name a few, are directly conducting research to help inform and guide us through this pandemic (https://www.worldpop.org/covid19).
Contribution Statement: Writing Initial Draft – JJN. Figures: JJN, AS, and MB. Writing- review and editing: All authors. All authors have read and agreed to the published version.

